

Wyandotte County, KS Real Estate Market: July 2026 Update
By Joe Nelson, Retired Air Force, Nelson Home Group Team Leader and Mortgage Loan Originator
The Wyandotte County, Kansas real estate market was the fastest of the Kansas City metro’s seven most populous counties in July 2026: homes went under contract in 26 days, sales jumped 16.9% to 173 closings, and supply tightened 20% to 2.4 months. The July median dipped 3.6% to $243,000, and that number needs context, because the year to date median is up 2.1%.
This is the Wyandotte County companion to the August 2026 Kansas City market update.
What did the Wyandotte County housing market do in July 2026?
| Key metric | July 2026 | Change vs July 2025 |
|---|---|---|
| Closed sales | 173 | +16.9% |
| Median sales price | $243,000 | -3.6% |
| Average sales price | $267,499 | -2.5% |
| Percent of original list received | 98.2% | 0.0% |
| Days on market | 26 | -7.1% |
| Pending sales | 146 | -9.3% |
| Inventory | 345 | -12.4% |
| Months of supply | 2.4 | -20.0% |
Source note: Heartland MLS Local Market Update, Wyandotte County, KS, July 2026.
Year to date, closings are up 6.6% on 1,001 sales, pendings are up 3.1%, and the median is up 2.1% to $240,000, the most affordable of the metro’s larger counties.
Why did the Wyandotte County median fall while sales jumped 16.9%?
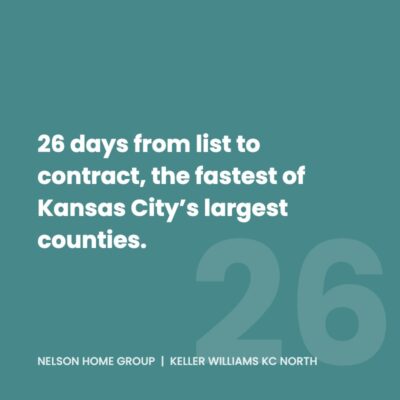
Clay and Johnson counties followed at 29 days each, against a metro average of 36.
Because more homes sold, and the mix of what sold skewed toward lower price points. That is what a 3.6% median dip alongside a 16.9% jump in closings actually describes. The median is the middle sale, not the value of any particular house, so when a county adds 25 extra closings concentrated in its most affordable range, the middle moves down even if every individual home held its value.
The year to date median, built on 1,001 sales instead of 173, is up 2.1%, and that is the honest number. Buyers did not suddenly get discounts. Sellers still collected 98.2% of their original asking price, identical to a year ago, which is not what a market looks like when values are actually falling. I made the same point about small county medians in my post on whether Kansas City home prices will drop: in a single month, on a small sample, the year to date column is the one to trust.
Why is Wyandotte County the fastest of the metro’s largest counties?
Affordability meets scarcity. A $243,000 July median makes Wyandotte County the entry point of the metro’s larger counties, roughly $107,000 below the metro median and well under Jackson County at $300,000, and that is exactly the price territory where buyer demand runs deepest. Meanwhile inventory fell 12.4% to just 345 homes. Supply at 2.4 months, down 20% in a year, means the buyers shopping there have little to choose from and no reason to wait. Twenty six days from list to contract is the result. My post on housing inventory versus months of supply explains why that 2.4 is the number to watch rather than the raw inventory count, and the June 2026 Wyandotte County market update showed the same pattern forming.
What does this mean if you are buying or selling in Wyandotte County?
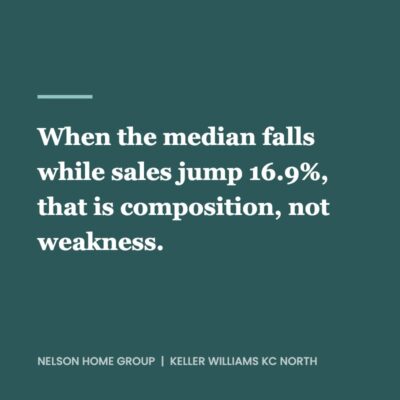
Sellers still collected 98.2% of their original asking price, identical to July 2025.
Sellers: speed is your leverage. Homes here sell faster than anywhere else among the metro’s big counties, faster than Clay and Johnson at 29 days and less than half of Platte County at 54, so an accurately priced listing should expect strong early activity and you can plan a move around a shorter timeline than the rest of the region allows. My breakdown of how long it takes to sell a house in Kansas City shows what that first month is worth.
Buyers: come pre approved and decisive, because 26 days is the average, not the fast end, and the well priced homes move quicker still. And judge the market on the year to date line, not one month’s median.
Leavenworth County rounds out the July county reports: July sales rose 12.8% and year-to-date closings are running at roughly double the metro pace. Read the Leavenworth County July 2026 update.
Frequently Asked Questions
What is the median home price in Wyandotte County, Kansas?
The median sales price in Wyandotte County, Kansas was $243,000 in July 2026, down 3.6% from a year earlier, while the year to date median rose 2.1% to $240,000. The single month dip came from a sales mix that skewed affordable during a 16.9% surge in closings, not from falling home values.
How fast do homes sell in Wyandotte County?
Faster than anywhere else among the Kansas City metro’s largest counties. Wyandotte County homes averaged 26 days on market until sale in July 2026, against a metro average of 36 days. Sales volume also jumped 16.9% year over year to 173 closings, so the speed came with more transactions, not fewer.
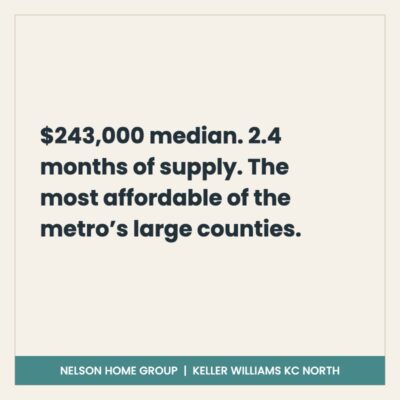
Inventory fell 12.4% over the year to just 345 homes for sale.
Is Wyandotte County affordable compared to the rest of Kansas City?
Yes. Its $243,000 July 2026 median was roughly $107,000 below the metro median of $349,900 and less than half of Johnson County’s $505,500, making Wyandotte County the most affordable of the metro’s larger counties. That affordability is a big reason its homes sell the fastest among them.
Is Wyandotte County a seller’s market in 2026?
Yes. Supply fell 20% to 2.4 months in July 2026, well under the three month seller’s market threshold, and inventory dropped 12.4% to 345 homes. Sellers benefit from the fastest sales pace among the metro’s large counties, though the county’s price ceiling means accurate pricing still decides which listings capture that speed.
Ready to Talk?
KCK moves fast. If you want to buy or sell where the metro’s big counties turn over quickest, my team is ready when you are.
Call: (816) 680-6624
KW KC North Office: (816) 452-4200
Email: [email protected]
Web: https://nelsonhomegroupkc.com/
Citations
- Heartland MLS Local Market Update, Wyandotte County, KS, July 2026 (current as of Aug 7, 2026): “Median Sales Price* $251,968 $243,000 -3.6% $235,000 $240,000 +2.1%”, “Closed Sales 148 173 +16.9%” and year to date “939 1,001 +6.6%”, “Average Sales Price $274,314 $267,499 -2.5%”, “Percent of Original List Price Received 98.2% 98.2% 0.0%”, “Days on Market Until Sale 28 26 -7.1%”, “Pending Sales 161 146 -9.3%” and year to date “995 1,026 +3.1%”, “Inventory 394 345 -12.4%”, “Supply 3.0 2.4 -20.0%”. View the report on ShowingTime, also on file with Nelson Home Group.
- Heartland MLS Local Market Update, Kansas City metro, July 2026: “Median Sales Price* $336,900 $349,900 +3.9%”, “Days on Market Until Sale 34 36 +5.9%”. View the report on ShowingTime, also on file with Nelson Home Group.
- Heartland MLS Local Market Updates, July 2026, for the comparison counties: Johnson County, KS “Median Sales Price* $505,500” and “Days on Market Until Sale 29”; Jackson County, MO “Median Sales Price* $300,000 +4.2%”; Clay County, MO “Days on Market Until Sale 30 29 -3.3%”; Platte County, MO “Days on Market Until Sale 43 54 +25.6%”. Reports on file with Nelson Home Group.