

Johnson County, KS Real Estate Market: July 2026 Update
By Joe Nelson, Retired Air Force, Nelson Home Group Team Leader and Mortgage Loan Originator
The Johnson County, Kansas real estate market posted a $505,500 median sales price in July 2026, up 5.3% from a year ago, and sellers received 100.4% of their original list price on average. Over asking, as a countywide average. With 1,025 closings, 2.1 months of supply, and 83.5% of resales selling inside their first 30 days, Johnson County remains the strongest demand story in the Kansas City metro.
This is the Johnson County companion to the August 2026 Kansas City market update, with the county-level numbers behind the metro story.
What did the Johnson County housing market do in July 2026?
| Key metric | July 2026 | Change vs July 2025 |
|---|---|---|
| Closed sales | 1,025 | +4.9% |
| Median sales price | $505,500 | +5.3% |
| Average sales price | $589,329 | +1.0% |
| Percent of original list received | 100.4% | +0.2% |
| Days on market | 29 | +7.4% |
| Pending sales | 756 | -11.3% |
| Inventory | 1,680 | -2.2% |
| Months of supply | 2.1 | -8.7% |
Source note: Heartland MLS Local Market Update, Johnson County, KS, July 2026.
Year to date, closings are up 8.9% and the median is up 3.6% to $483,000. Against the metro’s $349,900 median and 2.6 months of supply, Johnson County runs about $155,000 more expensive and meaningfully tighter.
Why are Johnson County homes selling over asking price?
Inventory fell only 2.2% in July while months of supply fell 8.7%, which is a pace story.
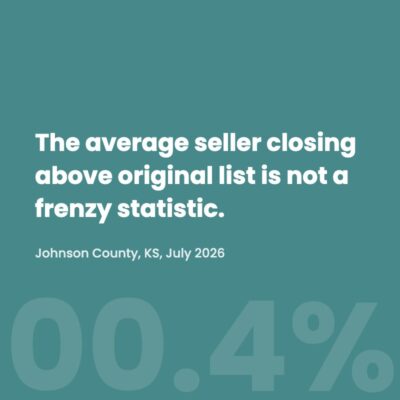
Because demand sped up while the number of homes for sale barely moved. Inventory dipped just 2.2%, but supply fell 8.7%, from 2.3 months to 2.1, and the only way that math works is a faster sales pace. Closings rose 4.9% in a month when metro pendings were falling. Layer on the speed stat, 83.5% of resales gone inside 30 days, the highest share in the metro, and you get a county where well-priced listings still create their own competition. The average seller closing above original list is not a frenzy statistic; it is what happens when accurate pricing meets a deep buyer pool. The full explanation of why supply can fall faster than inventory is in housing inventory versus months of supply.
Johnson County is the only county in the entire Heartland MLS footprint that averaged at or above 100% of original list price in July. The next closest, Clay County, came in at 99.5%. It also carries the highest average sale price of any county in the region at $589,329, roughly 15% above the runner-up.
Is there any soft spot in the Johnson County numbers?
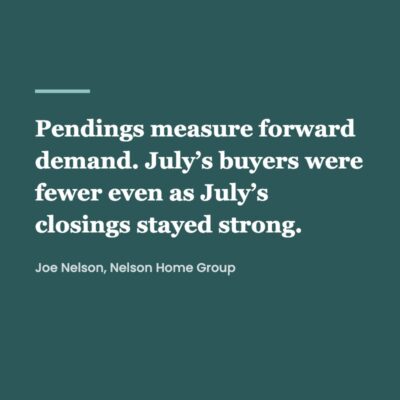
One, and it deserves attention: pending sales fell 11.3%, the steepest dip among the metro’s large counties. Pendings measure forward demand, so July’s buyers were fewer even as July’s closings, written a month or two earlier, stayed strong. Year to date pendings are still up 5.3%, so one month is not a trend, but if the dip repeats into September, the fall market here softens first at the negotiating table, not in the closed prices. The June 2026 Johnson County market update showed pendings already cooling, so this is the second consecutive soft reading.
What does this mean if you are buying or selling in Johnson County?
Year to date pendings are still up 5.3%, so one month does not make a trend.
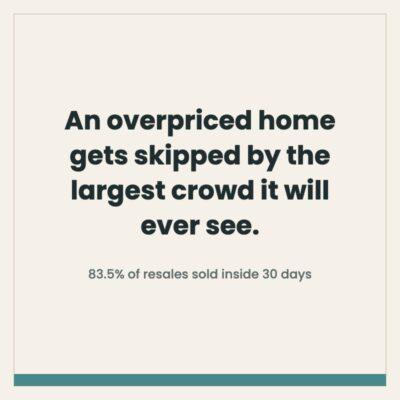
Sellers: the first weekend is everything. With 83.5% of resales selling inside 30 days and the county averaging over original list, an accurately priced home still commands a premium, and an overpriced one gets skipped by the largest buyer crowd it will ever see. Buyers: bring your strongest offer to anything well priced under $600,000, and remember the leverage math changes as you climb; the metro’s supply loosens substantially above $1.5 million. Either way, the pending sales line is the one to watch this fall. For the metro wide picture, see how long it takes to sell a house in Kansas City, and the Wyandotte County update for the fastest large county pace in July.
Leavenworth County rounds out the July county reports: July sales rose 12.8% and year-to-date closings are running at roughly double the metro pace. Read the Leavenworth County July 2026 update.
Frequently Asked Questions
What is the median home price in Johnson County, Kansas?
The median sales price in Johnson County, Kansas was $505,500 in July 2026, up 5.3% from July 2025, according to the Heartland MLS Local Market Update. Year to date the median is $483,000, up 3.6%. The average sales price was $589,329, the highest of any county in the Kansas City metro.
Are Johnson County homes selling over asking price?
On average, yes. Johnson County sellers received 100.4% of their original list price in July 2026, the only county in the Kansas City metro above 100%. That figure includes any price reductions along the way, and 83.5% of resales went under contract within their first 30 days on market.
Johnson County homes averaged 29 days to contract, seven days faster than the metro.
Is Johnson County a seller’s market in 2026?
Yes. Johnson County had 2.1 months of housing supply in July 2026, down 8.7% from a year earlier, and anything under three months is considered a seller’s market. The county pairs the metro’s highest prices with some of its fastest sales, though pending sales dipped 11.3% in July, a number worth watching this fall.
How fast do homes sell in Johnson County?
Fast. Homes averaged 29 days on market until sale in July 2026, and 83.5% of resales sold within their first 30 days, the highest share in the Kansas City metro. Listings that miss that first month window face much longer odds, which makes accurate day one pricing the deciding factor.
Ready to Talk?
If you are making a move in Johnson County, on either side of the deal, my team works these numbers every week.
Call: (816) 680-6624
KW KC North Office: (816) 452-4200
Email: [email protected]
Web: https://nelsonhomegroupkc.com/
Citations
- All Johnson County figures (median $505,500 up 5.3%; average $589,329 up 1.0%; 1,025 closed sales up 4.9%; 100.4% of original list received; 29 days on market; pending sales 756 down 11.3%; inventory 1,680 down 2.2%; supply 2.1 months down 8.7%; YTD closings up 8.9%, YTD median $483,000 up 3.6%, YTD pendings up 5.3%). Source: Heartland MLS Local Market Update, Johnson County KS, July 2026, current as of August 7, 2026.
- Metro comparison figures (median $349,900, supply 2.6 months). Source: Heartland MLS Local Market Update, July 2026.
- Highest average sale price and only county at or above 100% of original list. Verified against all 19 county reports in the July 2026 Heartland MLS archive. Runner up on average price is Platte County at $509,946; runner up on percent of list is Clay County at 99.5%. The Platte County July 2026 report explains how that average crossed half a million on a 9.3% median gain. And if the national headlines have you wondering, I answered whether Kansas City home prices will drop with the July data.
- 83.5% of resales sold inside 30 days. Source: Vanderpool and Fosgate July 2026 Market Statistics, Johnson County resale table, updated August 10, 2026. Report on file with Nelson Home Group, not publicly hosted.