

Clay County, MO Real Estate Market: July 2026 Update
By Joe Nelson, Retired Air Force, Nelson Home Group Team Leader and Mortgage Loan Originator
The Clay County, Missouri real estate market is now the tightest in the Kansas City metro: 1.9 months of supply in July 2026, down 24.0% in a year, with just 633 homes for sale after inventory collapsed 20.1%. The median held at $350,000, homes went under contract in 29 days, and sellers received 99.5% of original list price.
This is the Clay County companion to the August 2026 Kansas City market update, and it covers my team’s home turf in the Northland.
What did the Clay County housing market do in July 2026?
| Key metric | July 2026 | Change vs July 2025 |
|---|---|---|
| Closed sales | 389 | -3.5% |
| Median sales price | $350,000 | 0.0% |
| Average sales price | $380,682 | +1.4% |
| Percent of original list received | 99.5% | +0.4% |
| Days on market | 29 | -3.3% |
| Pending sales | 345 | -2.8% |
| Inventory | 633 | -20.1% |
| Months of supply | 1.9 | -24.0% |
Source note: Heartland MLS Local Market Update, Clay County, MO, July 2026.
Year to date, the county looks stronger than its flat July median suggests: closings are up 8.7%, pendings are up 7.7%, and the year to date median is up 3.0% to $345,000.
Why is Clay County the tightest market in the metro?
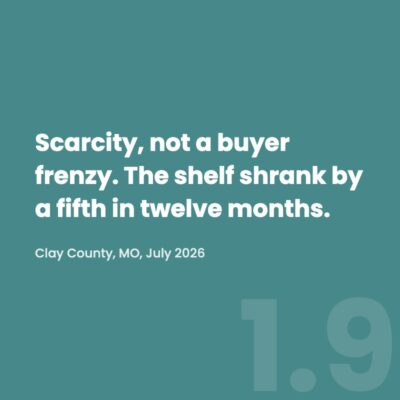
Clay County closings actually fell 3.5% in July, so this is a supply story, not a demand surge.
Scarcity, not a buyer frenzy. Closings actually slipped 3.5% in July, so demand did not surge. What changed is the shelf: the number of homes for sale fell by a fifth in twelve months, from 792 to 633. When inventory collapses that fast, supply collapses with it even at a steady sales pace, and 1.9 months of supply is deep seller’s market territory. The practical effect shows up in the other columns: 29 days to contract, 99.5% of list received, and multiple offers on anything priced to the comps. Across all 19 counties in the Heartland MLS footprint, no other county is under 2.0 months. The next tightest is Johnson County, Kansas at 2.1. For the mechanics of how supply can collapse without demand rising, read housing inventory versus months of supply.
This is not a new condition. The June 2026 Clay County market update put supply at 1.8 months on 600 active listings, so July’s 1.9 is a rounding tick inside a squeeze that has held all summer, not the start of relief.
Why did the Clay County median stay flat if supply is so tight?
Because tight supply defends prices; it does not automatically spike them. July’s median matched last July at $350,000 while the year to date median rose 3.0%, which tells you buyers are price sensitive and rate sensitive even in a market this thin. Sellers hold the leverage in Clay County right now, but they hold it at the right price. The county rewards accurate day one pricing and punishes the seller who tries to get ahead of the comps, because the thinner 2026 buyer pool will simply wait.
What does this mean if you are buying or selling in Clay County?
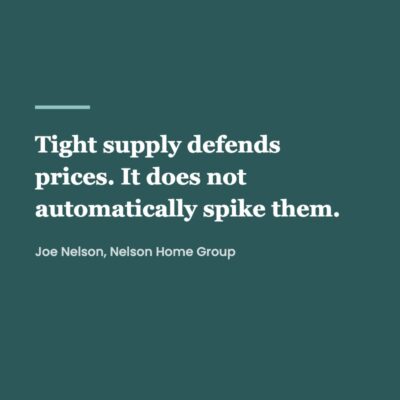
The year to date median is up 3.0% to $345,000 even though July came in flat.
Sellers: you have more leverage than any county in the metro, and the way to spend it is a sharp list price that turns scarcity into competing offers in week one. Buyers: 633 homes is a small shelf, so speed matters; get pre-approved before you shop, watch new listings daily, and expect company on anything well priced near the $350,000 median. Compare Johnson County’s demand driven version of tight in its own July update; both counties end in multiple offers, but the negotiating posture differs. Next door, the Platte County July 2026 report shows the opposite clock: 54 days to contract in the metro’s fastest-appreciating large county. For the metro-wide answer to the question behind all of these numbers, read whether Kansas City home prices will drop in 2026. Two companions cover the timeline side of this: how long it takes to sell a house in Kansas City, and the Wyandotte County update, where homes went under contract in 26 days.
Leavenworth County rounds out the July county reports: July sales rose 12.8% and year-to-date closings are running at roughly double the metro pace. Read the Leavenworth County July 2026 update.
Frequently Asked Questions
What is the median home price in Clay County, Missouri?
The median sales price in Clay County, Missouri was $350,000 in July 2026, unchanged from July 2025, according to the Heartland MLS Local Market Update. The year to date median is $345,000, up 3.0%, and the average sales price in July was $380,682, up 1.4%.
Why is housing supply so low in Clay County?
Because inventory collapsed. Clay County had 633 homes for sale at the end of July 2026, down 20.1% from 792 a year earlier. That pushed months of supply down 24.0% to 1.9 months, the tightest of any county in the Kansas City metro, even though closed sales slipped 3.5% over the same period.
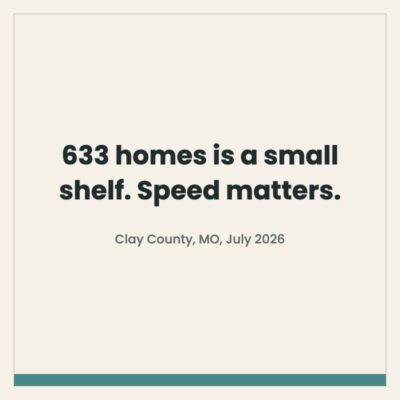
Clay County inventory fell from 792 homes to 633 in twelve months.
Is Clay County a good place to sell a house right now?
The numbers favor sellers strongly. With 1.9 months of supply, 29 days on market, and sellers receiving 99.5% of original list price in July 2026, accurately priced Clay County homes are selling quickly and near full price. The flat July median shows buyers remain price sensitive, so the advantage goes to sellers who price to the comps.
How fast are homes selling in the Northland?
In Clay County, the heart of the Northland market, homes averaged 29 days on market until sale in July 2026, faster than the Kansas City metro average of 36 days. Pending sales for the year are up 7.7%, so buyer activity in the Northland is holding up better than in most of the metro.
Ready to Talk?
The Northland is home base for my team. If you want to know what 1.9 months of supply means on your street, ask.
Call: (816) 680-6624
KW KC North Office: (816) 452-4200
Email: [email protected]
Web: https://nelsonhomegroupkc.com/
Citations
- All Clay County figures (median $350,000 flat; average $380,682 up 1.4%; 389 closed sales down 3.5%; 99.5% of original list received; 29 days on market; pending sales 345 down 2.8%; inventory 633 down 20.1%; supply 1.9 months down 24.0%; YTD closings up 8.7%, YTD pendings up 7.7%, YTD median $345,000 up 3.0%). Source: Heartland MLS Local Market Update, Clay County MO, July 2026, current as of August 7, 2026.
- Metro comparison figures (median $349,900, supply 2.6 months, 36 days on market). Source: Heartland MLS Local Market Update, July 2026.
- Tightest supply of any county. Verified against all 19 county reports in the July 2026 Heartland MLS archive. Next tightest is Johnson County, Kansas at 2.1 months.
- June 2026 supply of 1.8 months on 600 active listings. Source: Nelson Home Group, June 2026 Clay County market update, published July 21, 2026, from the Heartland MLS Local Market Update for June 2026. The Heartland archive publishes only the current month, so the June report is no longer retrievable at its original URL.