

Leavenworth County, KS Real Estate Market: July 2026 Update
By Joe Nelson, Retired Air Force, Nelson Home Group Team Leader and Mortgage Loan Originator
The Leavenworth County, Kansas real estate market is having its strongest year in the metro’s quieter corner: sales are up 10.4% year to date, July closings rose 12.8% to 132 homes, and the average July sale price jumped 10.2% to $409,068. The July median rose a steadier 2.3% to $357,950, and supply tightened 13.3% to 2.6 months.
This is the Leavenworth County companion to the August 2026 Kansas City market update, and if you are PCSing to Fort Leavenworth, this one is yours.
What did the Leavenworth County housing market do in July 2026?
| Key metric | July 2026 | Change vs July 2025 |
|---|---|---|
| Closed sales | 132 | +12.8% |
| Median sales price | $357,950 | +2.3% |
| Average sales price | $409,068 | +10.2% |
| Percent of original list received | 97.1% | -0.3% |
| Days on market | 45 | +36.4% |
| Pending sales | 98 | -1.0% |
| Inventory | 251 | -4.2% |
| Months of supply | 2.6 | -13.3% |
Source: Heartland MLS Local Market Update, Leavenworth County, KS, July 2026.
Year to date, closings are up 10.4% and the average price is up 8.6% to $392,738. Closings running at roughly double the metro’s 5.2% year-to-date pace is the number worth sitting with.
What is driving Leavenworth County’s sales surge?
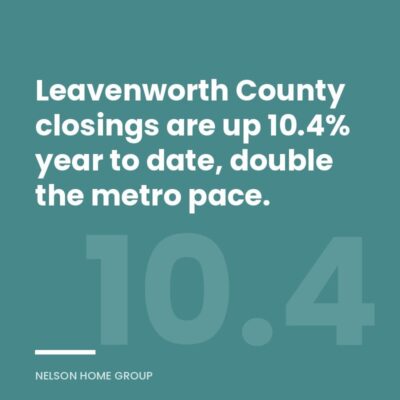
Year-to-date closings reached 701 through July, up from 635 a year earlier.
Two currents. First, the Fort Leavenworth move cycle keeps a steady stream of military families cycling through the county every summer, and those are relocations my team works constantly, on both the agent and the lending side. Second, the value equation: a $357,950 median buys considerably more house here than the same money buys across the county line in Johnson County, and buyers priced out of the metro’s core have noticed. The average price jumping 10.2% while the median rose 2.3% says the growth is coming disproportionately from the county’s upper half, larger homes and acreage properties, rather than a broad repricing. The June 2026 Leavenworth County market update showed the same year-to-date strength building. For the rest of the picture, I broke down July in Johnson County, Clay County, Jackson County, Platte County, and Wyandotte County as well.
Should the 45-day market time worry Leavenworth sellers?
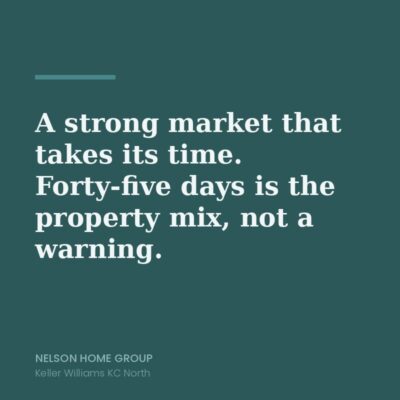
The metro average was 36 days in July, so Leavenworth runs nine days longer.
Watch it, but do not panic over it. Days on market jumped from 33 to 45, a 36.4% increase, and that is the one soft-looking number in the report. Context matters: this is a county of 132 monthly sales, where a handful of slow rural listings swings the average hard, and supply still tightened to 2.6 months, which is seller’s market territory. The honest read is a strong market that takes its time, especially on acreage and upper-bracket properties. Sellers should build their plans around a six-week window and price for the buyers actually in the market this fall.
What does this mean for PCS buyers and Fort Leavenworth families?
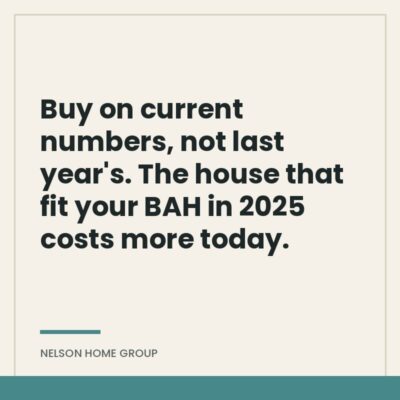
Buy on current numbers, not last year’s. The county is appreciating, so the house that fit your BAH in 2025 costs more today, and with 251 homes for sale, the inventory around post is thinner than the sold signs suggest. Get pre-approved before you arrive, know the best places to live near Fort Leavenworth, and if you are VA-eligible, the VA Home Buying Guide covers the zero-down path start to finish. My team speaks both languages here, real estate and military, because I spent 21 years in the Air Force before I ever wrote a contract.
Frequently Asked Questions
What is the median home price in Leavenworth County, Kansas?
The median sales price in Leavenworth County, Kansas was $357,950 in July 2026, up 2.3% from a year earlier, according to the Heartland MLS Local Market Update. The average sales price told a stronger story, jumping 10.2% to $409,068, driven by growth in the county’s larger and higher-priced homes.
Are home sales increasing in Leavenworth County?
Yes, substantially. July 2026 closings rose 12.8% to 132 homes, and year-to-date sales are up 10.4% to 701, roughly double the Kansas City metro’s 5.2% year-to-date pace. Year-to-date pending sales are also up 9.3%, so the buyer pipeline remains full.
Inventory sat at 251 homes in July, down 4.2% from a year earlier.
Why do homes take longer to sell in Leavenworth County?
Homes averaged 45 days on market in July 2026, up from 33 a year earlier and above the metro’s 36-day average. The county’s mix includes rural and acreage properties that naturally take longer, and with only 132 monthly sales, a few slow listings move the average significantly. Supply still tightened to 2.6 months, so the market remains a seller’s market.
Is Leavenworth County a good market for military buyers?
It is one of the most military-shaped markets in the region, with the Fort Leavenworth move cycle driving steady demand each summer. Buyers using VA loans pay no down payment and no monthly mortgage insurance, which stretches BAH further. With the county appreciating, PCS buyers should get pre-approved early and shop on current data rather than last year’s prices.
Ready to Talk?
PCSing to Fort Leavenworth or selling near post, my team handles both sides of that move, and I have made a few of those moves myself.
Call: (816) 680-6624
KW KC North Office: (816) 452-4200
Email: [email protected]
Web: https://nelsonhomegroupkc.com/
Where do these numbers come from?
- All Leavenworth County figures: Heartland MLS Local Market Update, Leavenworth County KS, July 2026, current as of Aug 7, 2026. Verbatim: “Closed Sales 117 132 +12.8% 635 701 +10.4%”, “Average Sales Price* $371,141 $409,068 +10.2% $361,605 $392,738 +8.6%”, “Median Sales Price* $350,000 $357,950 +2.3%”, “Days on Market Until Sale 33 45 +36.4%”, “Inventory 262 251 -4.2%”, “Supply 3.0 2.6 -13.3%”.
- Metro comparison figures: Heartland MLS Local Market Update, July 2026. Median $349,900, up 3.9%. Closed sales year to date 22,703, up 5.2%. Days on market 36.