

Kansas City Market Update August 2026: KC Prices Rose While National Asking Prices Fell
By Joe Nelson, Retired Air Force, Nelson Home Group Team Leader and Mortgage Loan Originator
The August 2026 Kansas City market update comes down to one contrast. National asking prices fell 2.5% in June, the steepest drop in Realtor.com records going back to 2017, while Kansas City’s July median sales price rose 3.9% to $349,900. Supply sits at 2.6 months, firmly a seller’s market, and the typical home went under contract in 36 days.
What happened in the Kansas City housing market in July 2026?
The metro closed 3,886 homes in July, up 5.1% from a year ago, and the median sales price rose 3.9% to $349,900. Sellers received 98.1% of their original asking price on average, a figure that already accounts for any price cuts made along the way. Inventory fell 5.2% to 8,258 homes for sale, which pushed months of supply down to 2.6. Anything under three months favors sellers.
One number moved the other way. Pending sales, the homes going under contract right now, fell 7.4% from last July. Days on market ticked up from 34 to 36. Fewer buyers stepped up, but there were even fewer homes for them to buy, and that standoff is exactly why prices rose anyway.
| Measure | Kansas City (July 2026) | National (latest) |
|---|---|---|
| Closed median sales price | $349,900, up 3.9% | $440,600, record high, up 1.8% (NAR, June) |
| Asking prices | 98.1% of original list received | Down 2.5% year over year (Realtor.com, June) |
| Months of supply | 2.6, seller’s market | 4.6 (NAR, July) |
| Seller concessions | Not separately tracked by Heartland MLS | 46% of May sales, a May record (Redfin) |
Source note: Heartland MLS Local Market Update, July 2026; NAR existing-home sales releases for June and July 2026; Realtor.com June 2026 housing report; Redfin May 2026 seller concessions data.
Why are national headlines saying home prices are falling?
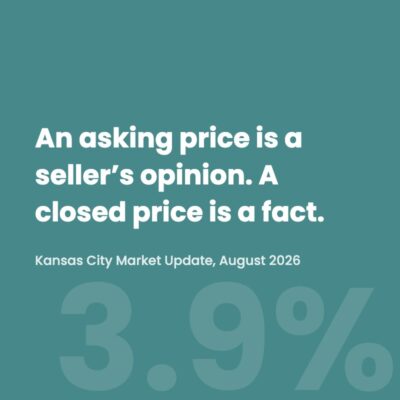
Heartland MLS sellers still collected 98.1% of original list price in July, price cuts included.
Because they are talking about asking prices, and asking prices are a different animal. An asking price is a seller’s opinion. A closed price is a fact. Realtor.com’s June data shows asking prices down 2.5% year over year, the steepest annual drop in their records since 2017, while NAR’s closed-price data shows the national median at a record $440,600. Both are true at once. Sellers nationally are pricing realistically on day one instead of listing high and cutting later, and Realtor.com’s chief economist Danielle Hale calls that “a welcome sign that we are in a functioning market.”
The national market has also handed buyers real leverage. New listings rose 2.4% year over year to 463,480 in June, and 46% of May sales included a seller concession, the highest May share Redfin has recorded. Whether a Kansas City buyer has that same leverage depends almost entirely on price range, and the county and price-band numbers below show why.
How does Kansas City compare to other metros right now?
The FHFA House Price Index, which tracks repeat sales of the same homes, has Kansas City up 2.91% over the past year against a national average of 2.1%. That is the 2026 second-quarter reading, released August 25, and the quarter itself was essentially flat here, down 0.22%. St. Louis ran ahead of Kansas City at 4.25% while Omaha trailed at 2.62%, and 24 of the 100 largest metros were negative year over year. The Midwest, short on homes for years, is the national appreciation story right now, while the Sun Belt metros that led the boom are flattening out.
Which Kansas City counties are hottest right now?
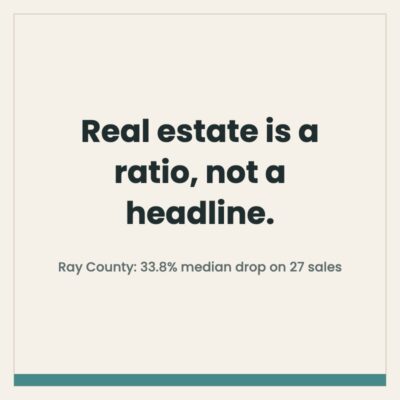
Ray County closed just 27 sales in July, which is why its year to date median is up 1.6%.
| County | July median | YoY change | Days on market | Months of supply |
|---|---|---|---|---|
| Clay, MO | $350,000 | 0.0% | 29 | 1.9 |
| Johnson, KS | $505,500 | +5.3% | 29 | 2.1 |
| Wyandotte, KS | $243,000 | -3.6% (YTD +2.1%) | 26 | 2.4 |
| Clinton, MO | $290,000 | -1.7% (YTD +10.9%) | 40 | 2.4 |
| Leavenworth, KS | $357,950 | +2.3% | 45 | 2.6 |
| Jackson, MO | $300,000 | +4.2% | 32 | 2.7 |
| Platte, MO | $425,000 | +9.3% | 54 | 2.7 |
| Ray, MO | $215,000 | -33.8% (YTD +1.6%) | 53 | 2.9 |
Source note: Heartland MLS Local Market Updates by county, July 2026. Sorted tightest supply first.
Clay County is the tightest market in the metro at 1.9 months of supply, and it got there through scarcity: inventory collapsed 20.1% to 633 homes. Johnson County got tight the other way, through demand, with sellers collecting 100.4% of original list price, over asking as a countywide average. Platte County is the appreciation leader at 9.3%, backed by a matching year-to-date number. The Platte County July 2026 report covers the tradeoff behind that number: 54 days to contract, the longest of the large counties. And treat small-county swings with suspicion: Ray County’s 33.8% July median drop came from 27 sales, and its year-to-date median is actually up 1.6%. Real estate is a ratio, not a headline. I explain why those two paths look identical on a sold sign but not on a pricing call in housing inventory versus months of supply.
What do falling pending sales mean for this fall?
Pending sales fell 7.4% in July, and that is the number to respect. It measures forward demand, the buyers committing right now rather than the closings from contracts written months ago. Year to date, pendings are still up 4.0%, so one soft month is not a trend. But pair it with inventory and you get the fall market’s early-warning system: if pendings keep falling while inventory levels off, supply starts climbing and pricing power moves toward buyers. In July both fell together, which is why sellers kept control. Compare that with the June 2026 Kansas City market update and you will see the same tug-of-war a month earlier. Tuesday’s post explains inventory versus months of supply in plain English, because those two get confused constantly and the difference is where this market’s story lives.
What does this mean if you are buying or selling right now?
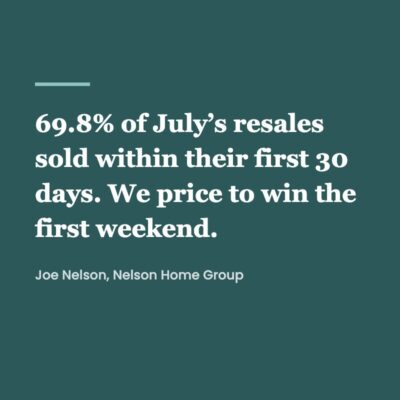
Metro days on market rose from 34 to 36, so winning the first weekend matters more, not less.
For sellers, the clock argument is the whole argument. 69.8% of July’s resales sold within their first 30 days on market, and listings that survived past day 30 saw their odds collapse. We price to win the first weekend. Thursday’s post runs the full days-on-market math. For buyers, the metro’s competitive core runs from $240,000 to $600,000, where every price band sits under 1.7 months of supply; above $1.5 million, supply runs near five months and the leverage flips. Rates averaged about 6.4% in the second quarter, and the newest forecasts moved higher, not lower, with Fannie Mae’s August 13 update lifting its 2027 outlook to roughly 6.7%, up from 6.3% a month earlier, so run your own numbers on the mortgage calculator rather than waiting on a rate the forecasts do not show. Friday’s post weighs the full buy-now question, including investor data that cuts both ways for entry-level buyers here. Wednesday’s post takes on the biggest question of all: whether Kansas City home prices are about to drop. Wyandotte County also posted the fastest sales pace of the metro’s large counties in July, at 26 days.
The two posts that close this series: whether now is a good time to buy a house in Kansas City, and the Leavenworth County July 2026 update.
Frequently Asked Questions
What was the median home price in Kansas City in July 2026?
The median sales price across Heartland MLS was $349,900 in July 2026, up 3.9% from July 2025. Year to date, the median is $335,000, up 4.7%. The average sales price was $406,907, up 2.5%. All figures come from the Heartland MLS Local Market Update for July 2026, which covers the Kansas City region on both sides of the state line.
Is Kansas City a seller’s market right now?
Yes. Kansas City had 2.6 months of housing supply in July 2026, and anything under three months is considered a seller’s market. Sellers received 98.1% of their original list price on average, and homes went under contract in 36 days. The market is strongest between $240,000 and $600,000, where supply is tighter than the metro average.
Which Kansas City county has the tightest housing supply?
Clay County, Missouri had the tightest supply in the metro in July 2026 at 1.9 months, driven by a 20.1% drop in homes for sale. Johnson County, Kansas followed at 2.1 months, where sellers received 100.4% of original list price on average. All eight counties in the metro sat at 2.9 months of supply or less.
How does Kansas City compare to the national housing market?
Kansas City prices rose 2.91% over the past year while the national average rose 2.1%, according to the FHFA House Price Index for the second quarter of 2026, released August 25. The quarter itself was essentially flat here, down 0.22%, and 24 of the 100 largest metros were negative year over year. National asking prices fell 2.5% in June per Realtor.com, but Kansas City’s closed prices kept climbing.
What loans did Kansas City buyers use in July 2026?
Of 3,579 residential resale closings tracked in July 2026, roughly 58% used conventional financing, 17% were cash, 12% used FHA loans, and 285 closings, about 8%, used VA loans. The remaining 5% were USDA, other, or unreported. About one in five closings used a government-backed loan with a low or zero down payment requirement.
Ready to Talk?
If July’s numbers have you thinking about a move, on either side of the transaction, my team and I do this every day and we would love to work with you. And if you or someone you know is moving to Kansas City, grab the free KC Relocation Guide on my website.
Call: (816) 680-6624
KW KC North Office: (816) 452-4200
Email: [email protected]
Web: https://nelsonhomegroupkc.com/
Citations
- Kansas City metro figures (median $349,900 up 3.9%; YTD median $335,000 up 4.7%; average $406,907 up 2.5%; 3,886 closed sales up 5.1%; 98.1% of original list received; 36 days on market; pending sales 3,163 down 7.4%, YTD up 4.0%; inventory 8,258 down 5.2%; supply 2.6 months down 7.1%). Source: Heartland MLS Local Market Update, July 2026, current as of August 7, 2026.
- County figures. Source: Heartland MLS Local Market Updates by county, July 2026, current as of August 7, 2026.
- Kansas City 2.91% annual appreciation, national 2.1%. Source: FHFA House Price Index Report, 2026 Q2, released August 25, 2026. Kansas City, MO-KS: 2.91% one-year, -0.22% quarter. St. Louis 4.25%, Omaha 2.62%.
- National asking prices down 2.5%, steepest since 2017; new listings 463,480, up 2.4%; Danielle Hale quote. Source: Realtor.com June 2026 Housing Report.
- National median existing-home price record $440,600, up 1.8% (June 2026); 4.6 months of supply (July 2026). Source: NAR existing-home sales, June 2026 and July 2026.
- 46% of May sales included a seller concession, a May record. Source: Redfin, May 2026. Redfin’s figure is 46.2%.
- Second-quarter 30-year rate average about 6.4%. Source: Freddie Mac Primary Mortgage Market Survey, Q2 2026 average 6.41%.
- Fannie Mae 2027 rate outlook near 6.7%, revised up from 6.3%. Source: Fannie Mae Economic and Strategic Research Housing Forecast, August 13, 2026 and July 2026.
- 69.8% of resales sold within 30 days; 3,579 residential resale closings and financing mix; price band supply. Source: Vanderpool and Fosgate July 2026 Market Statistics, Heartland MLS residential resale, updated August 10, 2026. Report on file with Nelson Home Group, not publicly hosted.