

Is the fall housing market in Kansas City slowing for seasonal reasons?
By Joe Nelson, Retired Air Force, Nelson Home Group Team Leader and Mortgage Loan Originator
Seasonality may explain part of the slower fall housing market in Kansas City, but August’s year-over-year contract decline means it is not a complete explanation. My experience is that activity often eases from July 4 through Labor Day, followed by a smaller fall pickup. This year, I am watching whether that pickup actually develops before calling it a rebound.
Planning a Kansas City move? Get my free KC Relocation Guide to help you prepare.
What does the fall housing market in Kansas City usually feel like in my business?
The late-summer lull is familiar to me. I often see people delay a move during the stretch between July 4 and Labor Day, and then some buyers become more focused on being in a home before the holidays or winter. I think of that fall activity as a smaller version of spring. It is an observation from my business, not a guarantee about every year.
When I shared my initial read on September 13, our contract activity felt slower, and the August numbers did not surprise me. I was also beginning to see a small uptick in September, without anything massive. That is the distinction I want readers to hear: early movement can be encouraging while still falling short of a strong rebound. A pickup needs evidence beyond a few busier days.
What does the August comparison tell us beyond the calendar?
The regional Heartland MLS report recorded 3,036 new pending sales in August 2026, compared with 3,461 in August 2025, a 12.3% decline, the same regional drop I broke down in my September Kansas City market update. Closed sales were down 7.8%. Because those are comparisons with the same month last year, the normal position of August on the calendar cannot explain the whole difference by itself.
That does not identify the cause. Rates, available homes, and buyers’ personal circumstances may all be part of individual decisions, but this report does not assign a percentage of the decline to each factor. My view is that the strong spring pace could not simply continue indefinitely. I am treating that as an interpretation to test, rather than presenting it as something the MLS table calculated.
| Observation | What it can tell us | What it cannot establish |
|---|---|---|
| August pending sales down 12.3% year over year | Fewer new agreements than the same month in 2025 | The precise cause or September’s final result |
| My small early-September uptick | A dated change I noticed in my business | A completed regional rebound |
| Official August inventory down 4.8% | Fewer available homes than a year earlier | How many new listings arrived during August |
Source: Heartland MLS Local Market Update, August 2026, current September 8; Joe Nelson’s September 13 business observations. Official figures use the blended regional category.
How can a small uptick coexist with a weaker September outlook?

Heartland MLS sellers received 97.7% of original list price on average in August 2026, up from 96.9% a year earlier.
In that September 13 conversation, I said I thought September could be weaker than August. I also said I was seeing a slight increase from the quiet stretch. Those statements concern different comparisons. A modest improvement from a slow period does not guarantee that the month’s total will exceed the previous month’s total.
The complete September report is the proper next check on that view. This article uses August evidence and those dated early-September observations; it does not substitute them for completed September MLS results. If you are making a decision now, compare the actual current homes and offers as well. Do not ask a partial month to answer a full-month question.
What would make the fall pickup more convincing?
I want to see more than a stronger sold-price headline. I will look at whether new contracts improve and what happens to available inventory, with the same reporting categories and comparison periods kept consistent. County differences matter too. Johnson County’s 1.7% pending decline was much smaller than Wyandotte’s 39.1%, so one regional label can hide very different local conditions.
I also want to hear what buyers and sellers are doing in the transactions in front of us. More willingness to discuss terms would matter to clients who have been unable to move. I covered how buyers can approach those conversations in my look at Kansas City buyer negotiations this fall. But I will not turn a few examples into an invented regional acceptance rate. A useful market view leaves room for the next report to change your mind.
How should someone planning a move use this uncertainty?

The regional median sold price rose 8.0% to $350,000 in August 2026 even as new contracts fell.
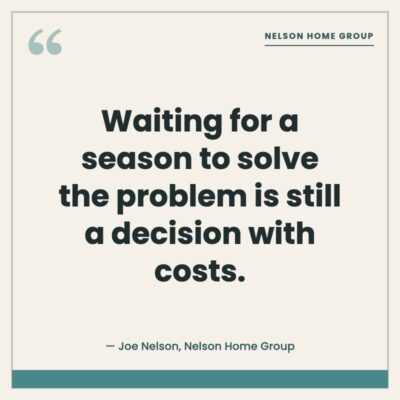
Use the fall housing market in Kansas City to frame better questions about your own move. If you need to sell, compare the current competing listings and the timing you can accommodate. If you need to buy, identify the homes you could actually choose and the terms that would make the purchase workable. Waiting for a season to solve the problem is still a decision with costs.
My guide to how long it takes to sell a house in Kansas City covers the timeline side of that decision. This update adds the current August activity and the fall pattern I am watching. The practical decision starts with your reason for moving and your alternatives. A market outlook is useful when it helps you make that comparison clearly.
Frequently Asked Questions
Is the July-to-Labor-Day slowdown a statistical finding in this article?
No. It is Joe’s description of a pattern he has observed in his business. The supplied August report provides monthly and year-to-date comparisons, not a quantified estimate of that specific seasonal effect. The article keeps his experience separate from the measured contract counts and does not promise that every fall will follow the same pattern.
Official regional supply was 2.6 months in August 2026, based on the trailing 12-month sales pace.
Why compare August 2026 contracts with August 2025?
Comparing the same calendar month reduces the confusion created by comparing different seasonal positions, such as spring with late summer. It does not remove every other difference between the years or identify a cause. The 12.3% pending-sales decline is useful evidence that the calendar alone is not a complete explanation of the change.
Did Joe say the September rebound had already arrived?
No. His September 13 observation was a small uptick, without a major increase. He also thought September could finish weaker than August. Those are dated observations and an outlook, not completed regional monthly results. Subsequent activity and the full September report are needed before describing the month as a confirmed rebound.
Should a fall seller wait automatically for a busier month?
The seasonal outlook cannot decide that for every seller. Compare your reason for moving, carrying costs, current competing homes, and timing flexibility. A busier period can also bring different competition. The useful choice is based on your actual alternatives and property, with the latest market evidence available when you make the decision.
Ready to Talk?
If the fall housing market in Kansas City has you stuck between acting and waiting, bring your timeline and the move you need to make. I can help you compare the choices in front of you.
Call or text: (816) 680-6624
KW KC North Office: (816) 452-4200
Email: [email protected]
Web: https://nelsonhomegroupkc.com/